
Overview
This project implements a full-stack smart grid simulation and monitoring dashboard for distributed energy systems. The system models five substations, ten distributed energy resources (DERs), and multiple industrial communication protocols (IEC 61850, Modbus TCP, OPC UA, OCPP 2.0). A Flask backend simulates IoT-style telemetry and grid events, while a dynamic frontend renders real-time KPIs, device status tables, anomaly alerts, and MQTT-style message logs.
The project demonstrates core principles of connected automation systems, including distributed networked architectures, protocol interoperability, event-driven monitoring, and infrastructure supervision. It simulates a spatially distributed energy system with cooperative nodes, illustrating how Industry 4.0 concepts such as IoT messaging, REST APIs, and real-time dashboards are applied to smart grids and supply systems.
The Dashboard
The web dashboard provides a real-time monitoring interface for a simulated smart grid environment.
System-Level KPIs
Active DER count (e.g., 9/10 online)
Total generation (MW)
Total load (MW)
Grid frequency (Hz) with anomaly highlighting
Total MQTT-style messages processed
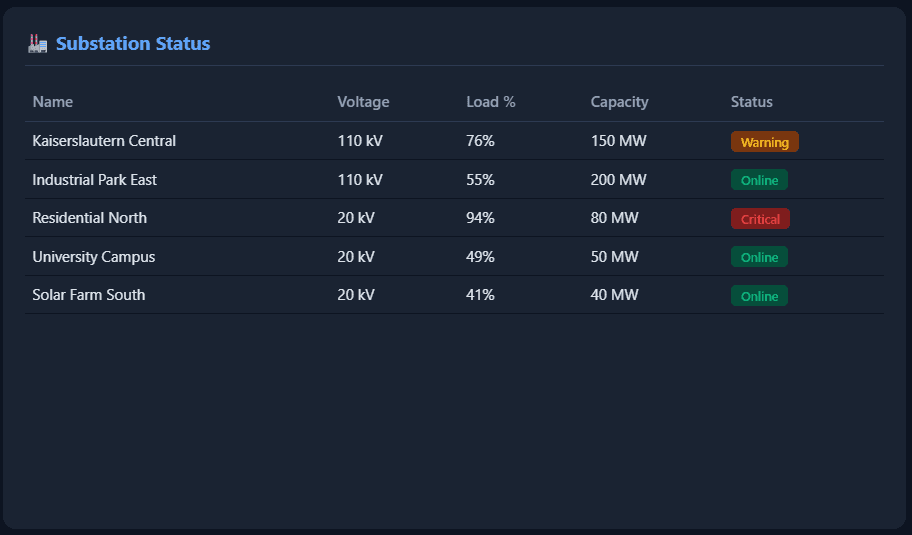
Substation Monitoring
Five substations (110 kV transmission + 20 kV distribution)
Load percentage per station
Capacity in MW
Status classification: Online / Warning / Critical
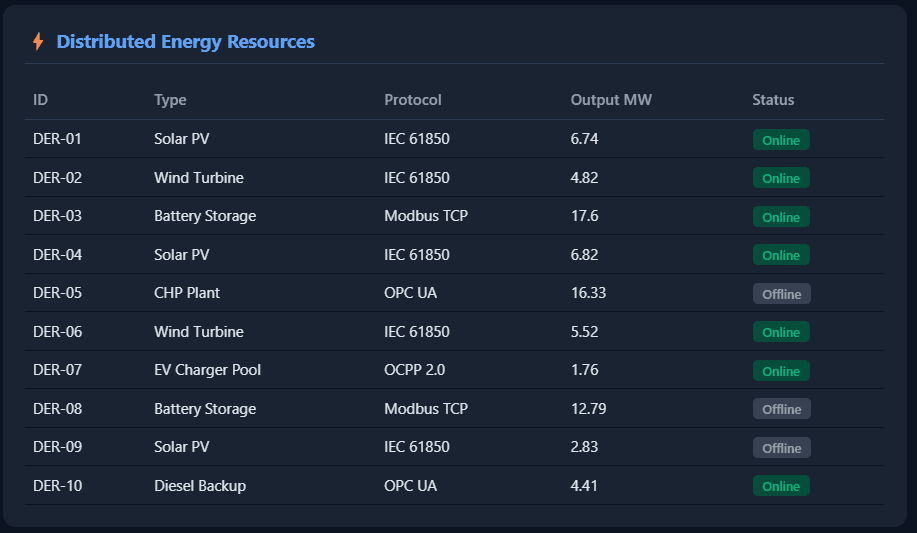
Distributed Energy Resources (DERs)
Ten DER units (Solar PV, Wind, Battery Storage, CHP, EV chargers, Diesel backup)
Industrial protocol per device
Real-time power output (MW)
Online/Offline status badges
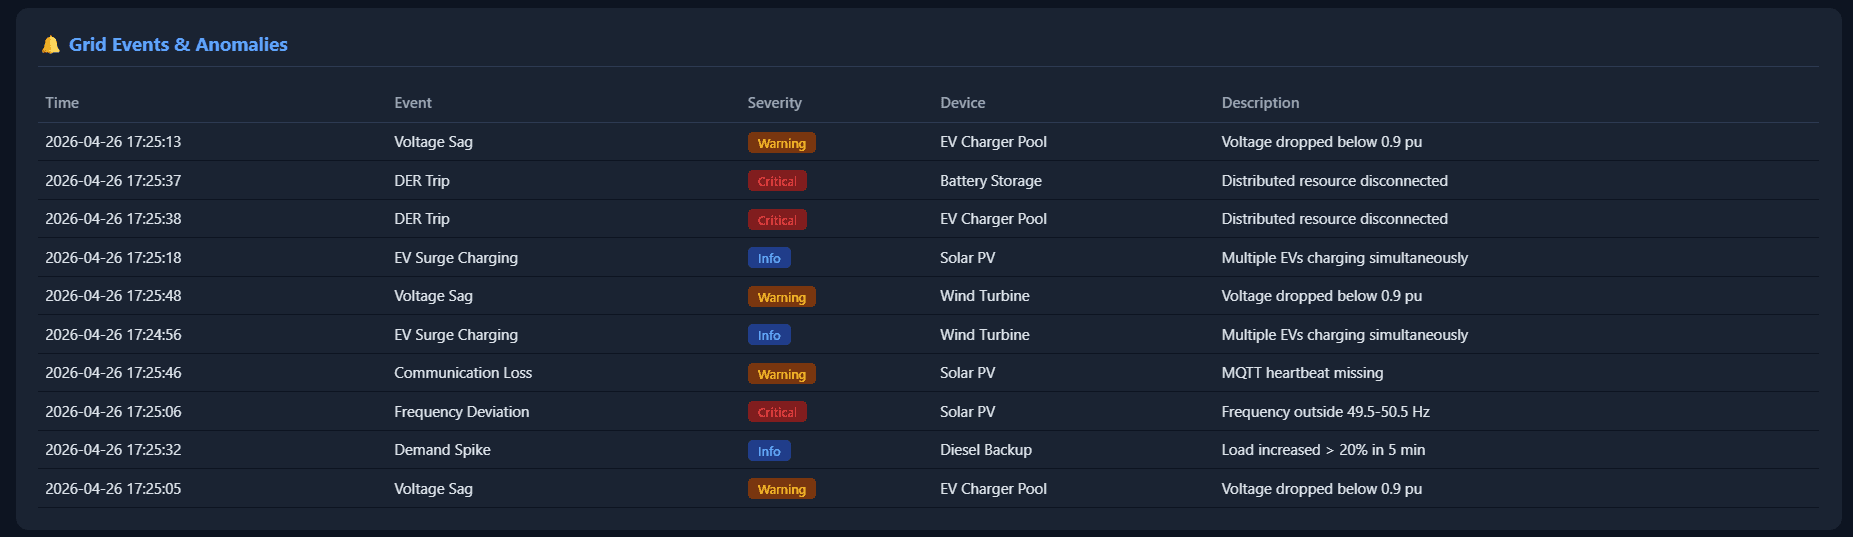
Grid Events & Anomalies
Eight event types (Voltage Sag, Frequency Deviation, Overload, DER Trip, etc.)
Severity classification (Critical, Warning, Info)
Timestamped anomaly tracking
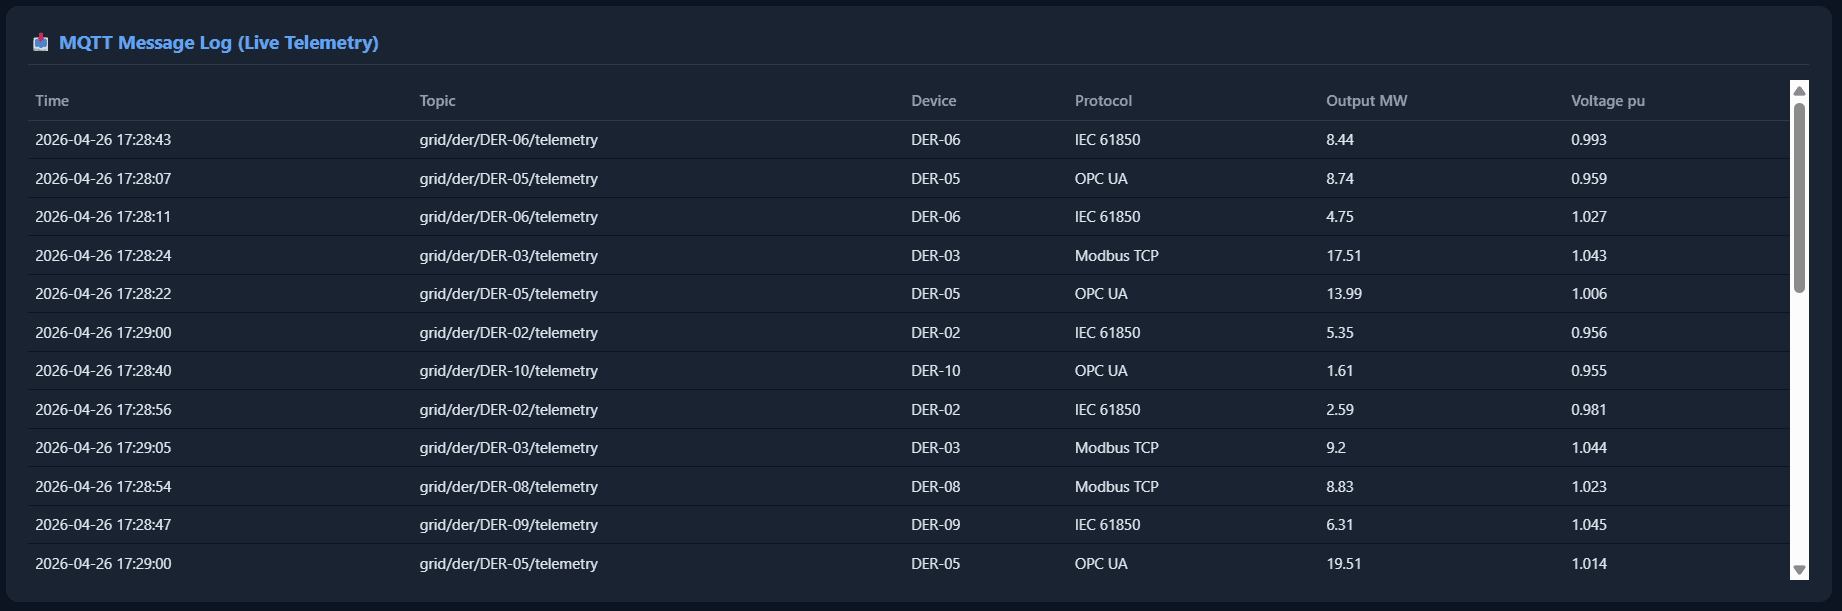
MQTT-Style Telemetry Log
Timestamped topics (e.g.,
grid/der/DER-01/telemetry)Protocol identification
Voltage (per unit) and output power
Auto-refresh every 5 seconds
The dashboard simulates networked IoT messaging and supervisory control in a distributed energy system.
Key Engineering Concepts
Distributed Energy Systems
Transmission (110 kV) and distribution (20 kV) grid layers
Aggregation of distributed generation
Industrial Communication Protocols
IEC 61850 — Utility automation for solar and wind
Modbus TCP — Battery storage communication
OPC UA — CHP and backup systems
OCPP 2.0 — EV charger interoperability
IoT & Messaging Architecture
MQTT-style telemetry topics
RESTful API endpoint (
/api/data)Periodic auto-refresh via asynchronous requests
Event-Based Monitoring
Randomized anomaly injection
Severity-based classification
Real-time alert visualization
System-Oriented Automation
Networked nodes
Cooperative distributed infrastructure
Infrastructure resilience simulation
Example Scenarios / Validation
1. Frequency Deviation Detection
When frequency drifts outside 49.7–50.3 Hz, the KPI indicator turns red, simulating grid stability monitoring.
2. Substation Overload
If load exceeds 90%, the station status changes to Critical, demonstrating capacity threshold supervision.
3. DER Communication Loss
Simulated anomalies trigger communication loss events, reflecting IoT reliability challenges.
4. EV Surge Charging Event
Multiple EV chargers simultaneously increase demand, generating grid event notifications.
5. Real-Time Telemetry Scaling
Each refresh cycle generates 5–15 new telemetry messages, simulating distributed IoT message flow.
Tech Stack
Python, Flask, HTML/CSS/JavaScript (custom frontend), Gunicorn, Render.com deployment, simulated MQTT-style messaging architecture.
Live Demo
Open Dashboard (may take 30s on first load)