Overview
Real-time IoT sensor monitoring dashboard for a smart factory floor. Simulates 8 machines with 5 sensor channels each, threshold-based alerting, and Isolation Forest ML anomaly detection.
This project simulates a smart factory environment with 8 industrial machines, each equipped with 5 IoT sensor channels: temperature, vibration, pressure, humidity, and power consumption. The system generates realistic sensor data with time-of-day shift patterns and injects two types of faults — gradual overheating on a Hydraulic Press (Machine 3) and periodic vibration spikes on an Injection Molder (Machine 6).
The dashboard provides factory operators with real-time visibility into machine health, combining traditional threshold-based alerting with Isolation Forest machine learning for anomaly detection. This dual approach catches both known failure patterns (threshold breaches) and unexpected deviations that rule-based systems would miss.
Features
8 machines with 5 IoT sensors each (temp, vibration, pressure, humidity, power)
Threshold-based alerts (warning + critical limits)
Isolation Forest ML anomaly detection
Factory floor health overview (bar chart)
Per-machine sensor trend charts with limit lines
Alert log with timestamp and severity
Detecting Machine Failures
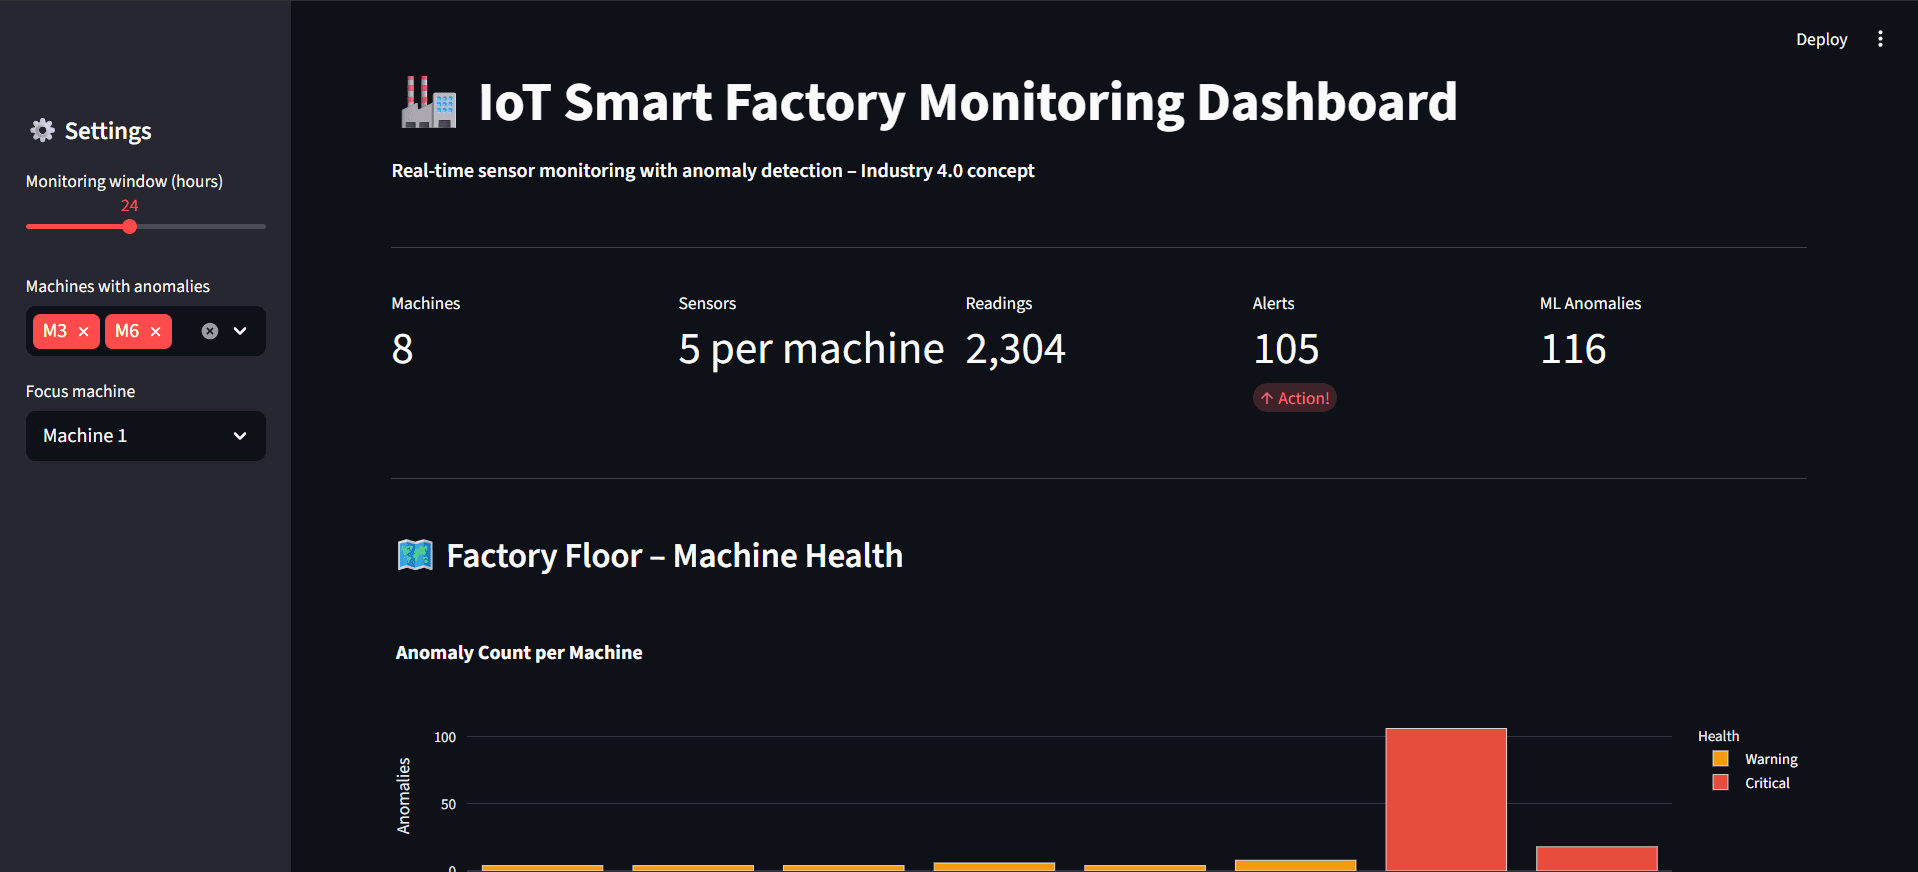
Machine 3 (Hydraulic Press) was programmed with a gradual overheating fault — temperature begins rising steadily after hour 12, eventually exceeding the critical limit of 85°C and reaching 144°C. The bar chart immediately flags Machine 3 as "Critical" (red) with over 100 anomalies, while Machine 6 shows as "Warning" (orange) due to intermittent vibration spikes.
The sensor trend charts display the raw data with warning (orange dashed) and critical (red dashed) limit lines overlaid. Red X markers pinpoint the exact moments anomalies were detected, giving operators a clear visual of when and where failures develop.
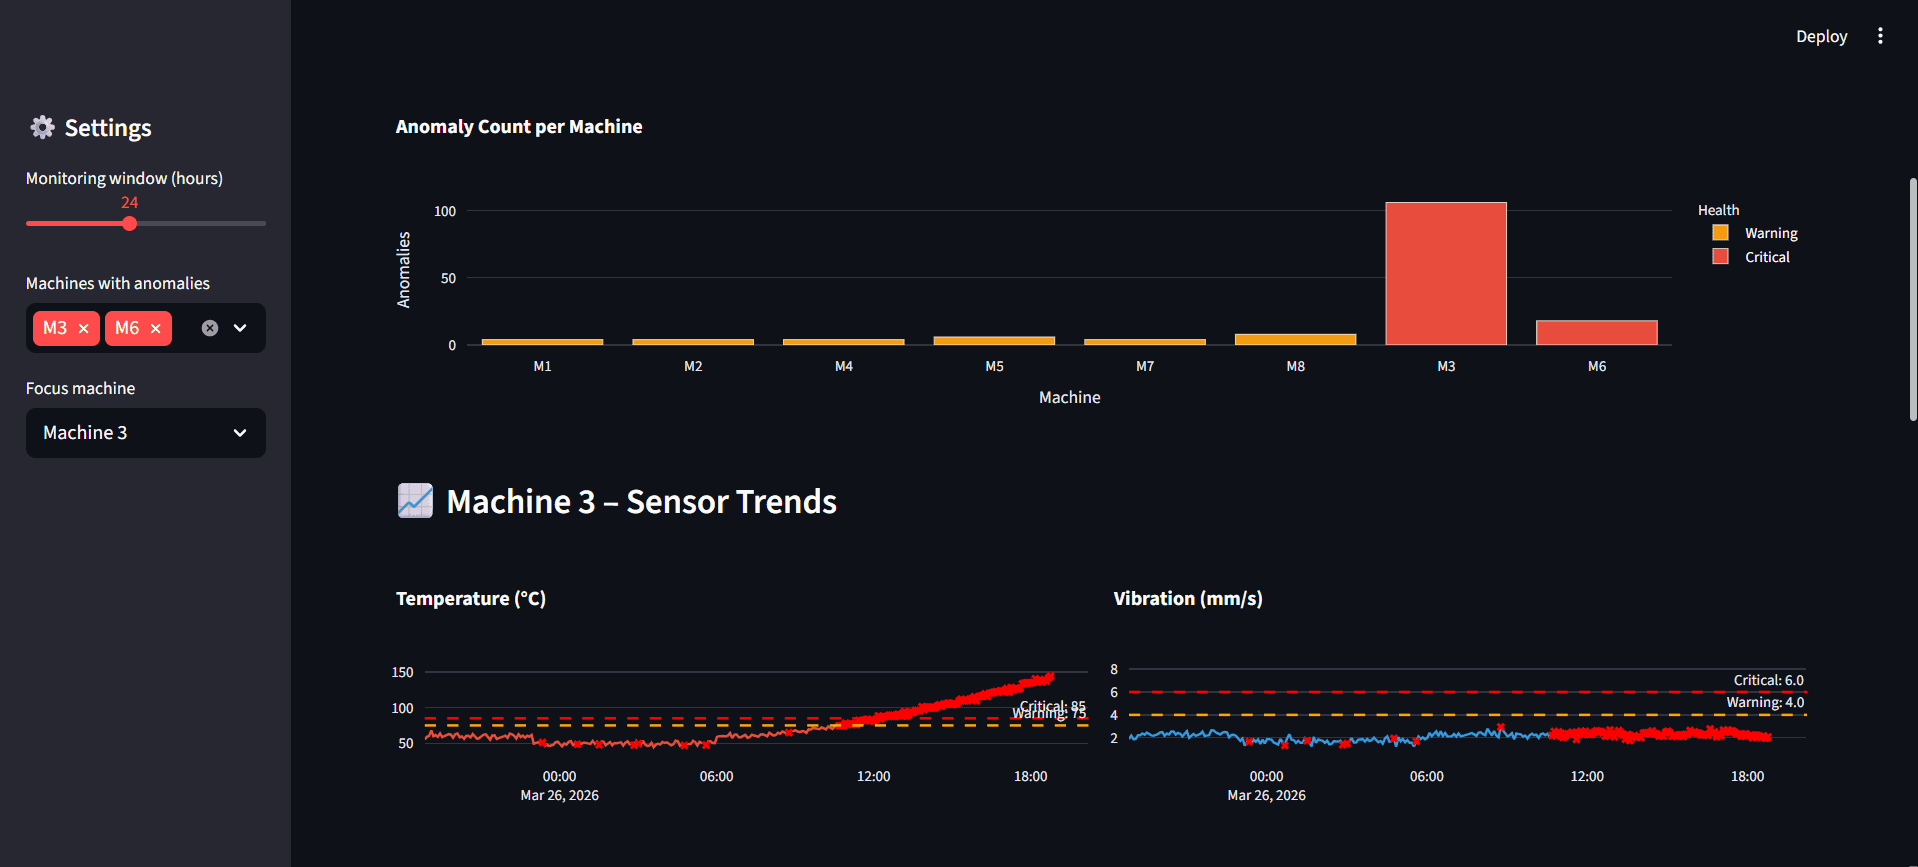
Machine 3 flagged as Critical — temperature trend shows gradual overheating beyond the 85°C critical limit, with anomaly markers (red X) pinpointing detection points
ML-Powered Detection with Isolation Forest
Beyond simple threshold checks, the system runs an Isolation Forest algorithm across all 5 sensor dimensions simultaneously. This unsupervised ML model identifies data points that are statistically "isolated" from normal operating patterns — catching subtle multi- sensor anomalies that a single-threshold approach would miss.
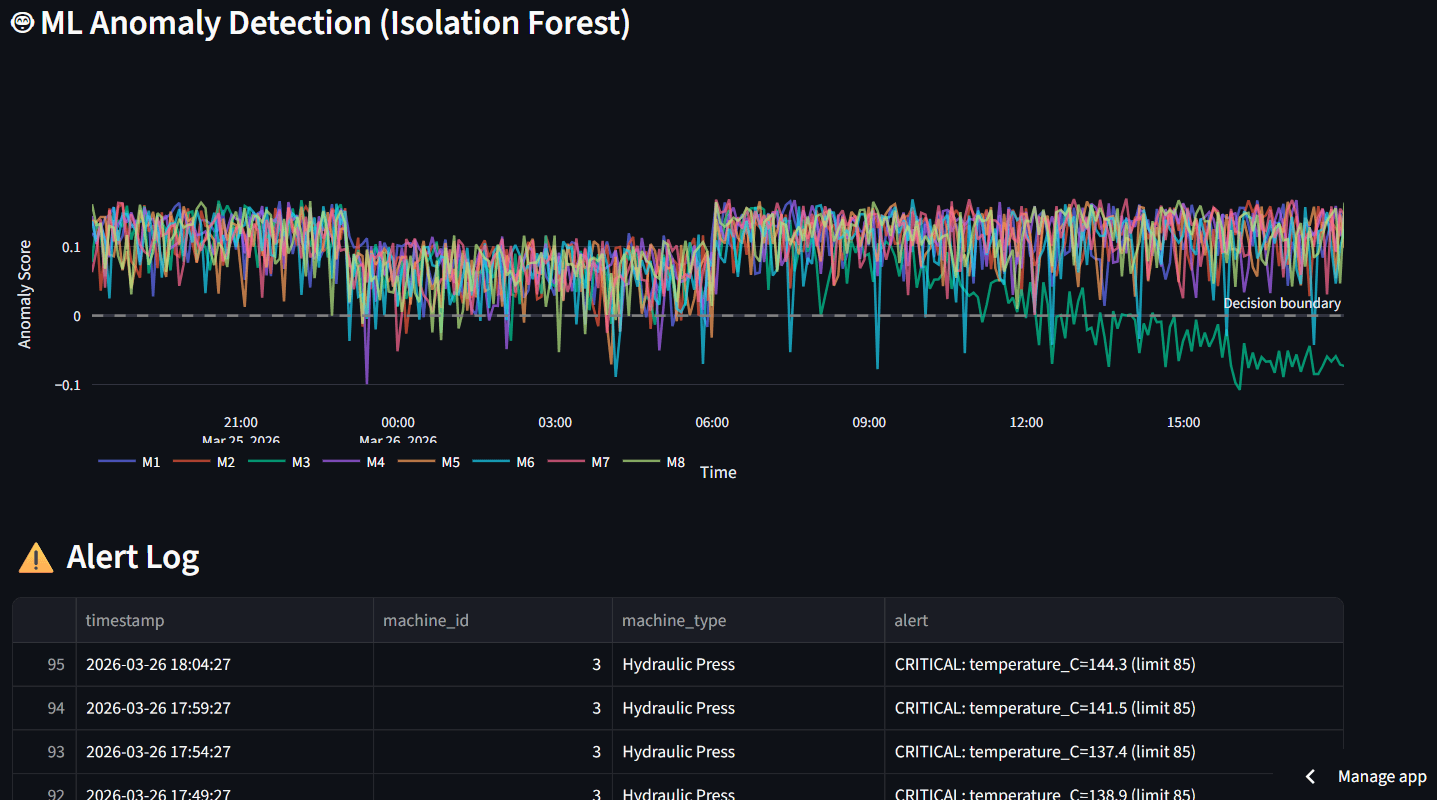
The anomaly score chart tracks all 8 machines over time. Scores above the decision boundary (dashed line at 0) indicate normal operation, while dips below suggest anomalous behaviour. Machine 3's score (green line) drops sharply as its temperature fault worsens, clearly separating it from healthy machines.
The alert log captures every threshold breach with timestamps, machine IDs, and severity levels, giving operators an actionable audit trail for maintenance decisions.
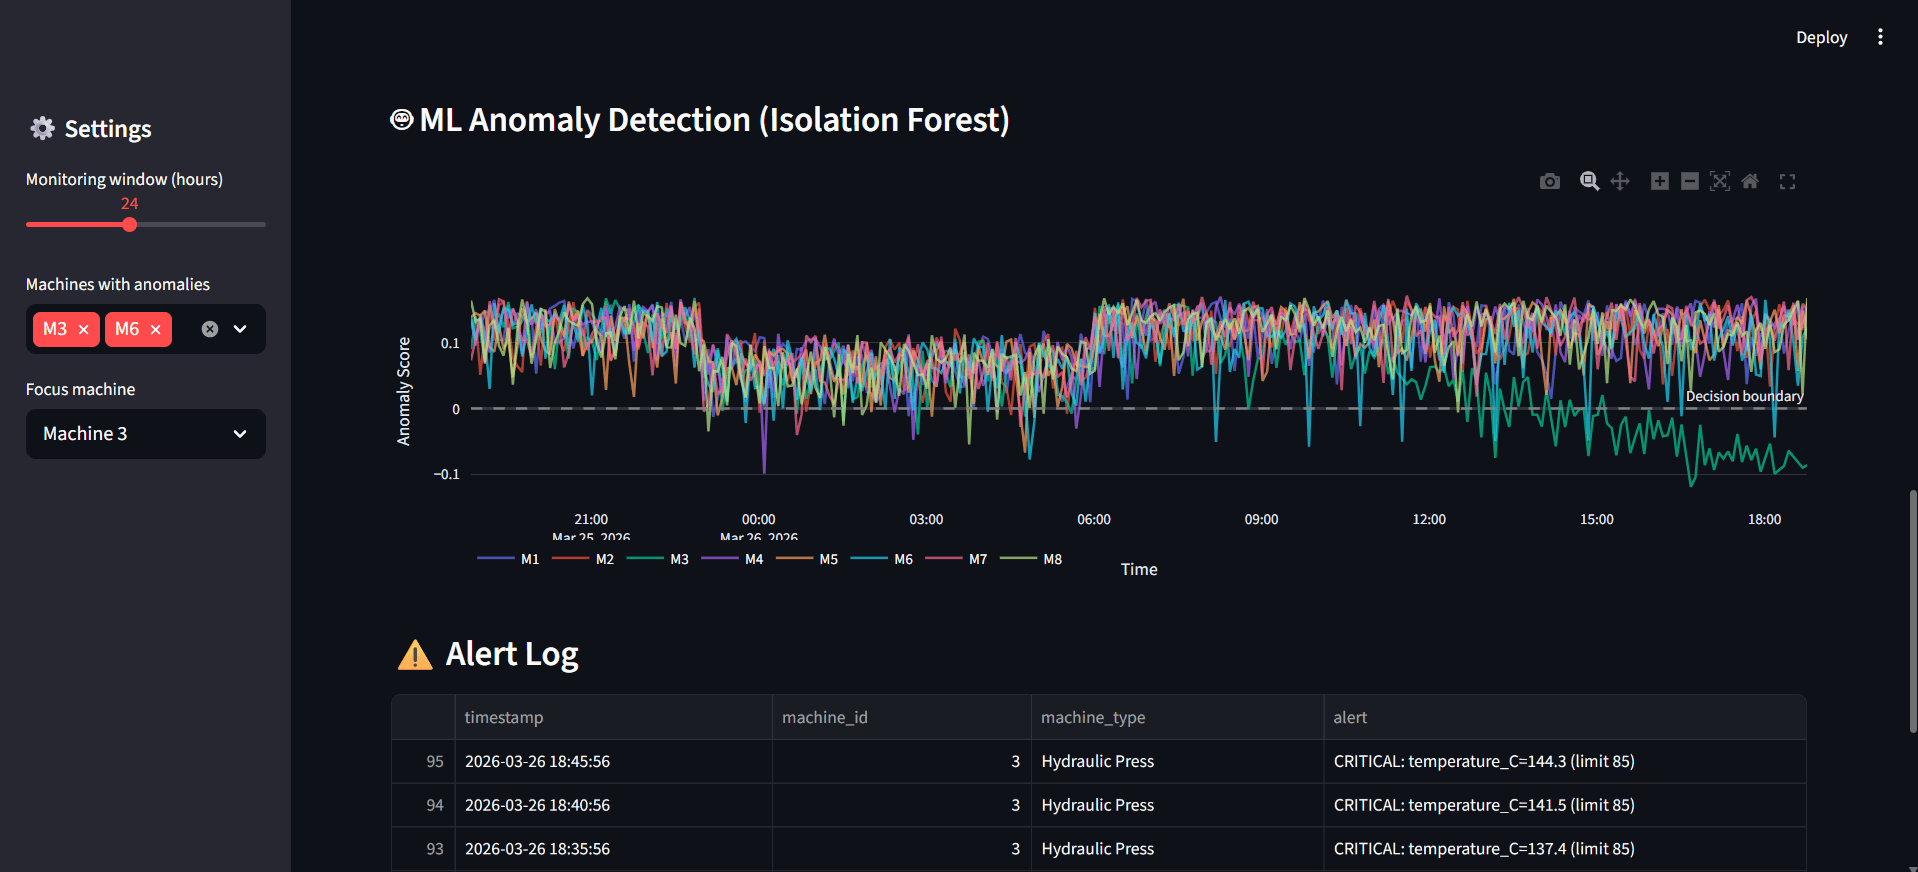
Isolation Forest anomaly scores for all 8 machines — Machine 3 (green) drops below the decision boundary as overheating progresses. Alert log shows CRITICAL temperature readings up to 144.3°C
Live Demo
Note: If the screen says "This app has gone to sleep due to inactivity." please click on restart app.